Model report: top 3, families and full-width charts
The model report puts the top 3 first, draws each model family as one line on cost against quality, and ranks every model on each task.
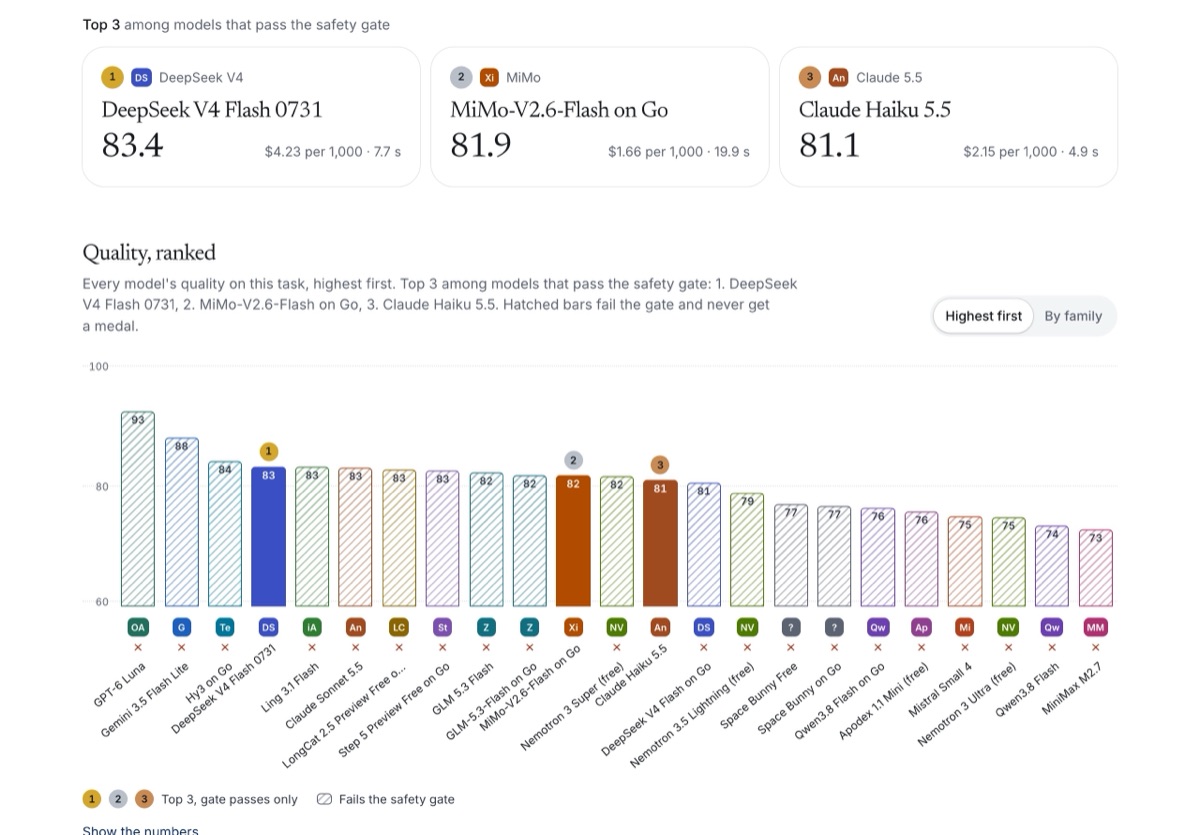
The model report is our own board for choosing which models serve Front Door. Its charts sat two to a row and were hard to compare. They now run full width, one after another.
- Top 3, gate passes only. Each task opens with its top 3 by quality, with numbered gold, silver and bronze medals. A model that fails the safety gate is never one of them, whatever its score.
- Quality, ranked. One bar per model, highest first, with the score in the bar and the maker under it. Switch to By family to see a family’s models side by side. Models that fail the gate are hatched and marked.
- Cost against quality. Each model family is one line, cheapest first, in its maker’s color and labeled at the right. Pick which models show, switch the cost axis between log and linear, and turn on the best-value line. Hollow dots fail the gate.
- Time to answer. The median (p50) and p95 for every model, with each timed answer as a faint dot. Fastest first or by family.
- Point at anything. Pointing at a dot, bar or row shows its numbers and grays the rest. Click or tap to pin the card and open the model’s page. Every chart still has a table of its numbers.